The War on Poverty Didn’t Fail
In 1988, President Reagan famously quipped that the federal government fought the war on poverty, and poverty won. A quarter of a century later, Paul Ryan, former Republican Speaker of the House, wrote, “Even though the federal government has spent trillions of taxpayer dollars on [War on Poverty] programs over the past five decades, the official poverty rate in 2014 (14.8 percent) was no better than it was in 1966 (14.7 percent), when many of these programs started.”
Amazingly, this assertion that the War on Poverty “failed” is pure fiction, a myth that won’t die. But no one can blame you for believing otherwise. The track record of progressive investments in the United States has, after all, been refracted through decades of bad data, bad statistics, bad analysis, and propaganda. As Americans, we look upon our shared history of progressive government investment as if confronting a fun-house mirror image warped in all directions.
However, it’s impossible to understand what we can achieve together in the future without understanding what we have already achieved together in the past. So let’s see how this fiction emerged.
The Origins of a Myth: Part I
The main evidence cited by War on Poverty defeatists such as Reagan and Ryan is that poverty rates have not declined very much according to the “official poverty rate.”
In fact, however, the “absolute poverty” rate in America — that is, the kind of poverty the official poverty rate is designed to capture based on a past standard of living — has plummeted. How is that possible? How can reasonable people disagree over something as basic as the share of Americans living in poverty? Here’s why: The official poverty rate is such a flawed measure of poverty that only people who are dazzled by the word official take it seriously.
The official poverty rate is such a flawed measure of poverty that only people who are dazzled by the word “official” take it seriously.
The official poverty rate suffers from three big, well-known problems: excessive inflation adjustment, excluded resources, and underreported resources. To understand these problems, we need to understand how the poverty rate is calculated.
The official poverty rate measures the share of Americans earning an income below a fixed dollar threshold in a given year. This threshold was developed in 1964 by a federal civil servant named Mollie Orshansky. The goal was to provide rough guidance to the White House’s new Office of Economic Opportunity so it could focus its efforts on the most disadvantaged communities. In a pinch, Orshansky improvised: She took the Department of Agriculture’s estimate of the bare-minimum food budget required to feed a family and multiplied this number by three. Since then, these thresholds have been updated annually for price inflation using the Consumer Price Index (CPI).
Given a threshold, we need to decide how to measure a family’s income to see if it falls above or below the threshold. The official poverty rate captures the share of Americans who report pretax cash income from the prior year that falls below an inflation-adjusted poverty threshold fixed in 1964. By this measure, the poverty rate fell by about 20 percent from 1964 to 1966 and then remained steady for decades. This is the primary evidence that War on Poverty critics such as Reagan and Ryan cite when they declare surrender.
The first problem with the official poverty rate is the adjustment for inflation. The CPI overstates inflation. It implies that the value of a dollar has fallen by about 4 percent per year since the 1960s, on average. In reality, the value of the dollar has fallen annually by only 3 percent or less. To give you a flavor of the mistakes involved in the CPI, suppose bottles of baby formula suddenly include 10 percent more formula but cost 10 percent more money. The CPI assumes we can buy 10 percent less baby formula with our dollars, suggesting inflation, when in reality we haven’t lost any purchasing power at all. (The actual problems aren’t quite this obvious, but the essential point holds.)
Overstating inflation by 1 percentage point per year creates enormous distortions over time. In particular, it causes the threshold used to define poverty to go up much faster than it should in reality. In 1964, a family of four counted as poor if it earned less than $3,169 in a year. Today, due to adjustments for inflation using the CPI, that threshold is almost $25,000. Consensus estimates of actual inflation suggest that a poverty threshold preserving the same standard of living from 1964 would today be about $14,000 rather than $25,000. This lower threshold would classify a much smaller share of the population as poor, indicating a much greater decline in poverty.
The second problem with the official poverty rate is excluded family resources. By counting only pretax cash income, the official poverty rate excludes many kinds of income that are designed in part to alleviate poverty: tax credits such as the Earned Income Tax Credit and noncash assistance such as SNAP and housing subsidies. Excluding these income sources and arguing that poverty rates have not fallen is strange. It’s like giving a sick person medicine that helps her recover and then arguing that she’s still technically sick because you can’t count the impact of the medicine.
The third problem with the official poverty rate is underreported resources. There is no perfect way to measure a family’s income. The official poverty rate relies on people responding accurately and honestly to survey questions about their prior year’s income. But it’s hard to remember exactly how much money you made last year (I have only a rough idea), and it’s hard to assess whether to be honest with a survey enumerator you’ve never met before. What if the survey enumerator is really a debt collector or program-eligibility officer trying to trick you into revealing your true income so they can cut off your benefits, or maybe even charge you with fraud?
It turns out these reporting problems are real, and they have been getting worse over the past 20 years. That is, people have reported a decreasing share of their actual income to survey enumerators. Today, when we add up all the income from programs such as welfare and SNAP that respondents divulge in surveys, we can only account for 50–60 percent of known federal expenditures on these programs. Increasingly, respondents either forget or decline to report this income. If low-income people report less income over time, that will exaggerate the persistence of poverty.
Recent claims that declining poverty has masked growth in “extreme poverty” turn out to be artifacts of the same kinds of faulty data.
When researchers adjust for all these problems, they find the poverty rate has fallen by 86 percent since 1964. Recent claims that declining poverty has masked growth in “extreme poverty” also turn out to be artifacts of the same kinds of faulty data. Once we focus on more meaningful and accurate metrics than those used by War on Poverty defeatists such as Ronald Reagan and Paul Ryan, we see their surrender was premature.
Does this mean we’ve eliminated poverty? No, it doesn’t. America is the only developed country in the world that fixates on “absolute” poverty, or poverty based on a fixed standard of living from the past. Every other country focuses on “relative” poverty based on comparison to a current standard of living. The most common measures define a family as poor if its income falls below 50 percent of median national income. By this measure, the United States has a much higher poverty rate than most other advanced countries, especially for children.
There are good reasons why other countries focus on relative poverty. Anyone with a shotgun and some protein bars would be living in luxury during the Middle Ages. Surely that doesn’t make them rich today, as absolute poverty measures would have us believe.
But, then again, this entire debate over poverty rates is a bad way to assess the impact of War on Poverty programs. Even if these programs succeeded, poverty rates could move in any direction due to unrelated demographic and technological trends — things like the crack and opioid epidemics, the rise of social media, the influx of Chinese manufacturing imports. The better approach is to measure the impact of specific skill-building programs on the participants’ outcomes as adults. And here we find that all the largest childhood investments composing the War on Poverty — Medicaid, Food Stamps, and Head Start — improve children’s future income and health, yield high return on investment, and largely pay for themselves in the form of higher tax revenue from the participants.
So the idea that the War on Poverty failed is pure fiction. Americans can and do create powerful programs to improve child skill development. There is every reason for optimism that a major new initiative such as one I call “Familycare” — a version of which I helped write into the policy platform of Pete Buttigieg’s presidential campaign in 2020, and which I outline in “The Parent Trap” — would succeed if politicians wanted it to succeed and focused on making it work better over time rather than relitigating its legitimacy or sabotaging its implementation.
But if all this is true, then why do so many Important People still claim the War on Poverty failed? Why exactly has this myth persisted for so long?
The Origins of a Myth: Part II
Here’s another way to frame the question: Why was the New Deal of the 1930s popular and today remembered with pride, whereas the War on Poverty of the 1960s was acrimonious and today remembered with disdain?
There are many reasons why these initiatives inspired such different reactions. The New Deal took place during the Great Depression. Many people at that time wondered if democratic capitalism had entered a permanent new phase of mass unemployment and feared that without some sense of hope the public would turn to communism or fascism. In this climate, even many conservatives sympathized with President Roosevelt’s insistence that the federal government had to be viewed as taking action — every action, any action — to alleviate hardship.
In contrast, the War on Poverty took place at a time of economic prosperity. Fewer people saw a need for radical government intervention in 1964, compared to 1934. However, there is another difference between these two programs: how they interacted with the existing racial order.
The New Deal took place at a time when white southern segregationists could block legislation at will. Southern senators chaired most key Senate committees and voted as a group on all legislation pertaining to civil rights and racial equality. This power assured that New Deal legislation had to respect Jim Crow institutions.
New Deal policymakers responded to this power in two ways. First, they made sure programs couldn’t be readily accessed by most Black workers. Second, they delegated program administration to state and local governments, which held no accountability to Black citizens due to their mass disenfranchisement after Reconstruction. The New Deal thereby carefully empowered southern governments to keep more funding in the pockets of white families.
The New Deal carefully empowered southern governments to keep more funding in the pockets of white families.
For example, Social Security old-age insurance excluded agricultural and domestic workers in part to exclude the 75 percent of Black workers in these two occupational groups. States managed Aid to Families with Dependent Children and Assistance for the Elderly Poor, thus localizing program administration to permit racial discrimination. Unemployment Insurance combined both of these strategies.
In contrast, the War on Poverty formed an important part of the National Democratic Party’s new repudiation of the southern racial order. This divorce between Democratic progressives and segregationists had many precursors, some of which began in the Roosevelt administration, even as it designed New Deal policies to exclude Black Americans. Examples include Roosevelt’s embrace of Black leaders, his Executive Order prohibiting racial discrimination in employment by federal contractors during World War II, and Harry Truman’s inclusion of civil rights in the Democratic Party platform in 1948. The Democratic Party had also become increasingly accountable to northern Black people. While southern Black people had been disenfranchised by terrorism and legal subterfuge, northern Black people were very much able to vote.
And then in 1963 John F. Kennedy ran for president, and all hell broke loose. In April 1963, Black leaders collaborating with Martin Luther King Jr. in Birmingham, Alabama, orchestrated a boycott of local stores to demand racial integration of employment and public accommodations (hotels, restaurants, etc.). White law enforcement responded, as usual, with violence. Americans watched on live television as police officers unleashed beatings, attack dogs, and water hoses on peaceful Black protesters, including children.
It was the middle of presidential campaign season. The public outcry over Birmingham jolted Kennedy. He finally declared support for national civil rights legislation.
The fallout was immediate. Southern whites poured out of the Democratic Party. In early 1963, before Kennedy endorsed civil rights legislation, 60 percent of southern whites supported his candidacy. From April to July, southern white support for him fell to 30 percent. Half of southern whites suddenly supported Goldwater. Outside the South, white support for Kennedy held firm.
The key thing about Goldwater? He opposed civil rights legislation. The other thing about Goldwater? He opposed every other kind of progressive government spending.
The economists Ilyana Kuziemko and Ebonya Washington have provided a clear view on the forces underlying this critical juncture. In the mid-2000s, the nonprofit Roper Center for Public Opinion Research released a trove of historical survey data from Gallup going back to the 1930s. As Kuziemko and Washington dug through the data, one survey question in particular caught their attention: “If your party nominated a well-qualified man for president, would you vote for him if he happened to be a Negro?” Between 1958 and 1972, Gallup asked the question nine separate times in exactly the same way. This gave the researchers a simple, consistent way to distinguish “racially conservative” whites from those with more tolerant views.
Kuziemko and Washington found this one survey question overwhelmingly predicted which southern whites would shift party allegiance in the 1960s. Whites abandoning the Democratic Party didn’t care what Goldwater thought about education or health care or Social Security. They didn’t express unusual views toward women, Catholics, Jews, or immigrants. They were just racist. The Democratic Party had repudiated their worldview, so they left it and became Republicans.
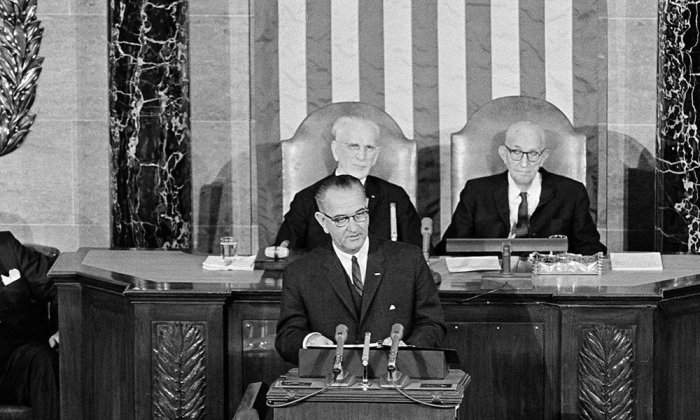
Kennedy’s announcement and the ensuing exodus of southern white voters transformed the Democratic Party into the antisegregation party. In November 1963, Kennedy was assassinated, and Lyndon Johnson assumed the presidency. In March 1964, another peaceful protest led by Martin Luther King Jr. in Selma, Alabama, once again provoked police brutality captured live on television. Less than a week later, Johnson emphatically backed civil rights legislation while speaking at Howard University, a leading historically Black university. Johnson ended the speech with the words “we shall overcome,” the gospel anthem of the Black civil rights movement.
Johnson followed words with action. The Civil Rights Act of 1964 prohibited racial discrimination in employment and public accommodations. Hotels, restaurants, grocery stores — all would henceforth require racial integration as a matter of federal law. The Voting Rights Act of 1965 ensured Black citizens a right to vote. The Immigration Act of 1965 removed racial quotas on immigration, finally overturning racist laws such as the Chinese and Japanese exclusion acts. The Civil Rights Act of 1968 prohibited racial discrimination in housing.
It was a new world. The fact that Lyndon Johnson ushered in this new world as president came as a double blow to southern white voters. Johnson had spent his career condoning Jim Crow and chumming around with segregationist southern colleagues at every stage of his life. His fierce advocacy for civil rights legislation as president was a shocking, Shakespearean betrayal of his own lifelong relationships.
The War on Poverty began in 1964 during the birth of this new political world. After 1963, white segregationists no longer acted as gatekeepers on Democratic progressive legislation because they were now Republicans. Lyndon Johnson therefore designed War on Poverty programs very differently than Franklin Roosevelt had designed New Deal programs three decades earlier. Instead of excluding Black people and facilitating local white discretion, War on Poverty programs included them, retained federal control, and prohibited racial discrimination by local administrators.
So the amazing fact is that the War on Poverty did not fail. It was just declared a failure from the start by people who resented its blunt imposition of racial equality.
Today, 60 years later, millions of Americans still embrace the idea that all big government programs are doomed to fail. While this view has persisted, its motivations have changed and it is now typically held in good faith. There really are reasons to worry that a big New Deal-style federal program such as Familycare could go off course. It could get buried in red tape, or captured by interest groups. It could be designed in ways that reward waste or inflate prices or stifle innovation. But the failure of earlier programs should not be cited to support this view, because these efforts have mostly succeeded. In fact, history suggests that a program such as Familycare could work well — and that finding ways to make it work well is one of the best things we could achieve together as a nation.
Nate G. Hilger is an economist and data scientist in Silicon Valley. His work on the origins of success in children has been featured in the New York Times, the Washington Post, the Atlantic, and other media outlets. He has published articles in the Quarterly Journal of Economics and other leading academic journals, and is the author of “The Parent Trap,” from which this article is adapted.