The Nuclear Fallout Maps That Revealed a Contaminated Planet
Today, pollutants of anthropogenic origin, starting with microplastics, are everywhere on our planet, deposited in the ice of the polar regions, dispersed in the upper atmosphere, and transported to the ocean depths. Scientific awareness of the global distribution of these pollutants is not new; our knowledge of the contamination of the world developed considerably throughout the 19th century and has continued to expand.
The focus here on the monitoring, surveillance, and study of the numerous nuclear tests during the Cold War is but a very recent manifestation. Nevertheless, this was a crucial historical step, as it led to the publication of the first global maps of the nuclear contamination of the world, making visible and palpable some of the effects of a possible nuclear war. Even more importantly, these new global views have reinforced our understanding of the entire biosphere as a radically interconnected ecological space. They thus strengthened the global environmental knowledge that forms the pillars of our current environmental concerns.
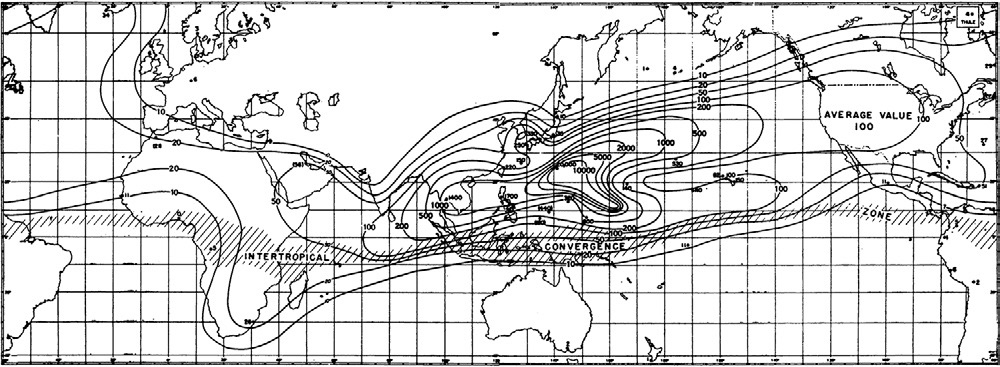
Two maps, published in 1956 in the midst of the Cold War by three U.S. Weather Bureau researchers in Science, reflect this important historic process. Later becoming iconic, they made it possible to trace the trajectories of radioactive particles around the globe. The first (below) shows the global and relatively rapid atmospheric diffusion of radioactive particles, originating from a small atoll in the Pacific and that, once injected into the stratosphere, continued on their way around the planet. The second complements these global diffusion pathways with a more quantitative map, consisting of isolines that indicate the average rates of concentration of radioactivity in the air as well as an “intertropical convergence zone” thought not to be crossed by these radioactive particles.
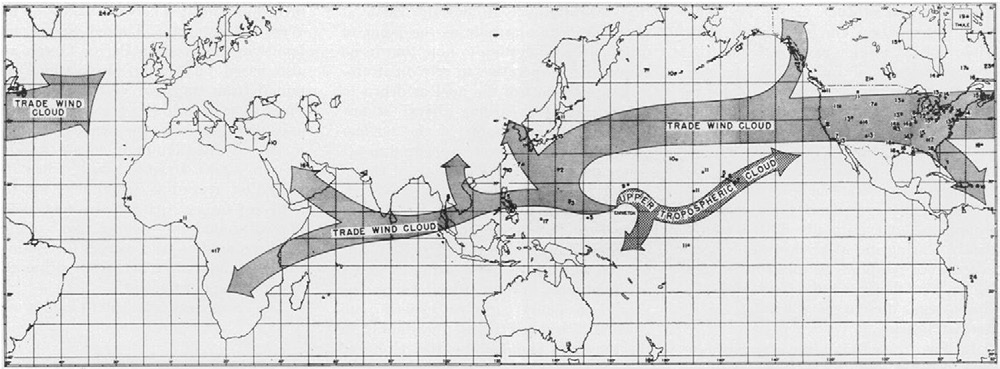
These two maps represent key scientific results of the first atmospheric nuclear tests conducted under the auspices of the Atomic Energy Commission (AEC) in the Pacific. They demonstrated the power of the new global atomic fallout monitoring network established by the United States and its allies in the late 1940s.
For its authors, the discovery of the world’s radioactive contamination was not foremost a source of concern but rather the realization of a long-held aspiration, namely the possibility of tracking volatile but easily identifiable tracers in the atmosphere. Previously, only exceptional and very large-scale events, such as the explosion of the volcano Krakatau in 1883, had made this possible. Of course, these are not the first maps of this kind; the visual tradition of illustrating atmospheric flows on a large scale dates back at least to the 17th century. Other earlier reports had, in fact, presented similar maps, but they remained long inaccessible, being classified as “top secret” defense matters. The publication of these two maps in the open literature thus testifies to the establishment of a new policy of the diffusion (certainly still very partial) of geophysical knowledge previously under security restrictions.
Different observation techniques emerged out of a desire on the part of nuclear powers to closely monitor foreign atomic activities.
Their publication was accompanied by a strong underlying tension that, since the beginning of the nuclear age, characterized all publications in this sector that were considered highly sensitive. Different observation techniques emerged out of a desire on the part of nuclear powers to closely monitor foreign atomic activities.
The first observation networks set up to detect nuclear activities were obviously military. They came into being at the end of the Second World War when the United States sought to determine the German nuclear program’s progress by measuring xenon-133 in air samples collected over suspect sites using military aircraft. Institutionalized as the AFOAT-1, this research unit, under the direct supervision of the Central Intelligence Agency and the AEC, saw its mission rapidly expand to include the monitoring of all nuclear activities, including not only nuclear tests but also nuclear reactor use and plutonium production. As early as 1949, it ran two scientific laboratories and had four squadrons of B-29 bombers dedicated to collecting air samples and 24 ground stations spread around the globe. Moreover, close collaboration with the British military made it possible to expand the network, allowing the unit to localize the Soviet Union’s first nuclear test in 1949. The accuracy of the network was subsequently considerably improved by the integration of all detection methods (i.e., seismic, radiological, and sonic), techniques that were continually evaluated as part of the U.S. nuclear tests in the Pacific.
The two maps thus evoke both the past and the future. They point to the past in that they are based on the long legacy of military surveillance of foreign nuclear programs, activities that have remained largely secret. But they also point to the future because they make visible two complementary structural aspects of the Cold War. First, the publishing of the maps in an “open” journal indicates the growing public pressure exerted on U.S. agencies following the radioactive contamination of the population of the Marshall Islands and of nearby Japanese fishermen in the Castle Bravo nuclear accident in March 1954. This event resulted in strong indignation on the part of Japanese as well as the international press, prompting several countries to implement nuclear counterexpertise around which various nascent environmental movements were organized.
The second aspect concerns the emergence of new global environmental knowledge. Indeed, nuclear tests led to the creation of key tools for better understanding atmospheric and oceanic planetary flows as well as to the exchanges of energy and matter that take place therein. This new geophysical knowledge forms the foundation of our current global atmospheric and oceanic circulation models. Importantly, in tracking the diffusion of radionuclides both through the atmosphere and through plants, animals, and human populations, scientists could demonstrate the integration and interconnectedness of the entire biosphere. Unsurprisingly, in her influential book “Silent Spring” published in 1962, Rachel Carson drew directly on such studies to denounce the circulation and accumulation of chemical pollutants, particularly the pesticide DDT, throughout the biosphere.
Giving visibility to the global processes of contamination enabled an emerging environmental movement to establish close links between very distant events on our planet.
We can thus see how the publication of these two maps of nuclear tests marks a historic moment in the construction of the idea of the world’s contamination on a global scale. Beyond their documentary value, the maps offer new perspectives on what the process of contamination means since the Cold War. Through them, we see the birth of a new world lastingly transformed by the massive injection of radioactive particles into the atmosphere during the numerous nuclear tests carried out in the Pacific and elsewhere. It is precisely this long-term modification of the environment that significantly contributed, throughout the Cold War, to the shift from the earth sciences to earth system sciences.
A historical analysis of our scientific knowledge of the mechanisms of global contamination warns us not to view nuclear tests solely from the perspective of atomic annihilation but to account for the historical antecedents that have led to the current diagnosis of environmental crisis, thus favoring a richer and more complex narrative. As is often the case in the sciences, visualizations also played a key role here. Giving visibility to the global processes of contamination enabled an emerging environmental movement to establish close links between very distant events on our planet. In this sense, global visualizations of radioactive contamination have not only contributed to the creation of new geophysical realities, but they have also drawn our attention to the fact that we inhabit extremely uneven geographies and the originators of environmental fears and the places affected by these changes rarely coincide.
Sebastian V. Grevsmühl is an associate professor of research at the CNRS in history of science and environment. He specializes in environmental history and visual studies. He has mainly written on the geophysical sciences, polar history, and the role of images in science. This article is excerpted from the volume “Cultures of Contagion.”